Pricing
Price is what you pay and value is what you get.
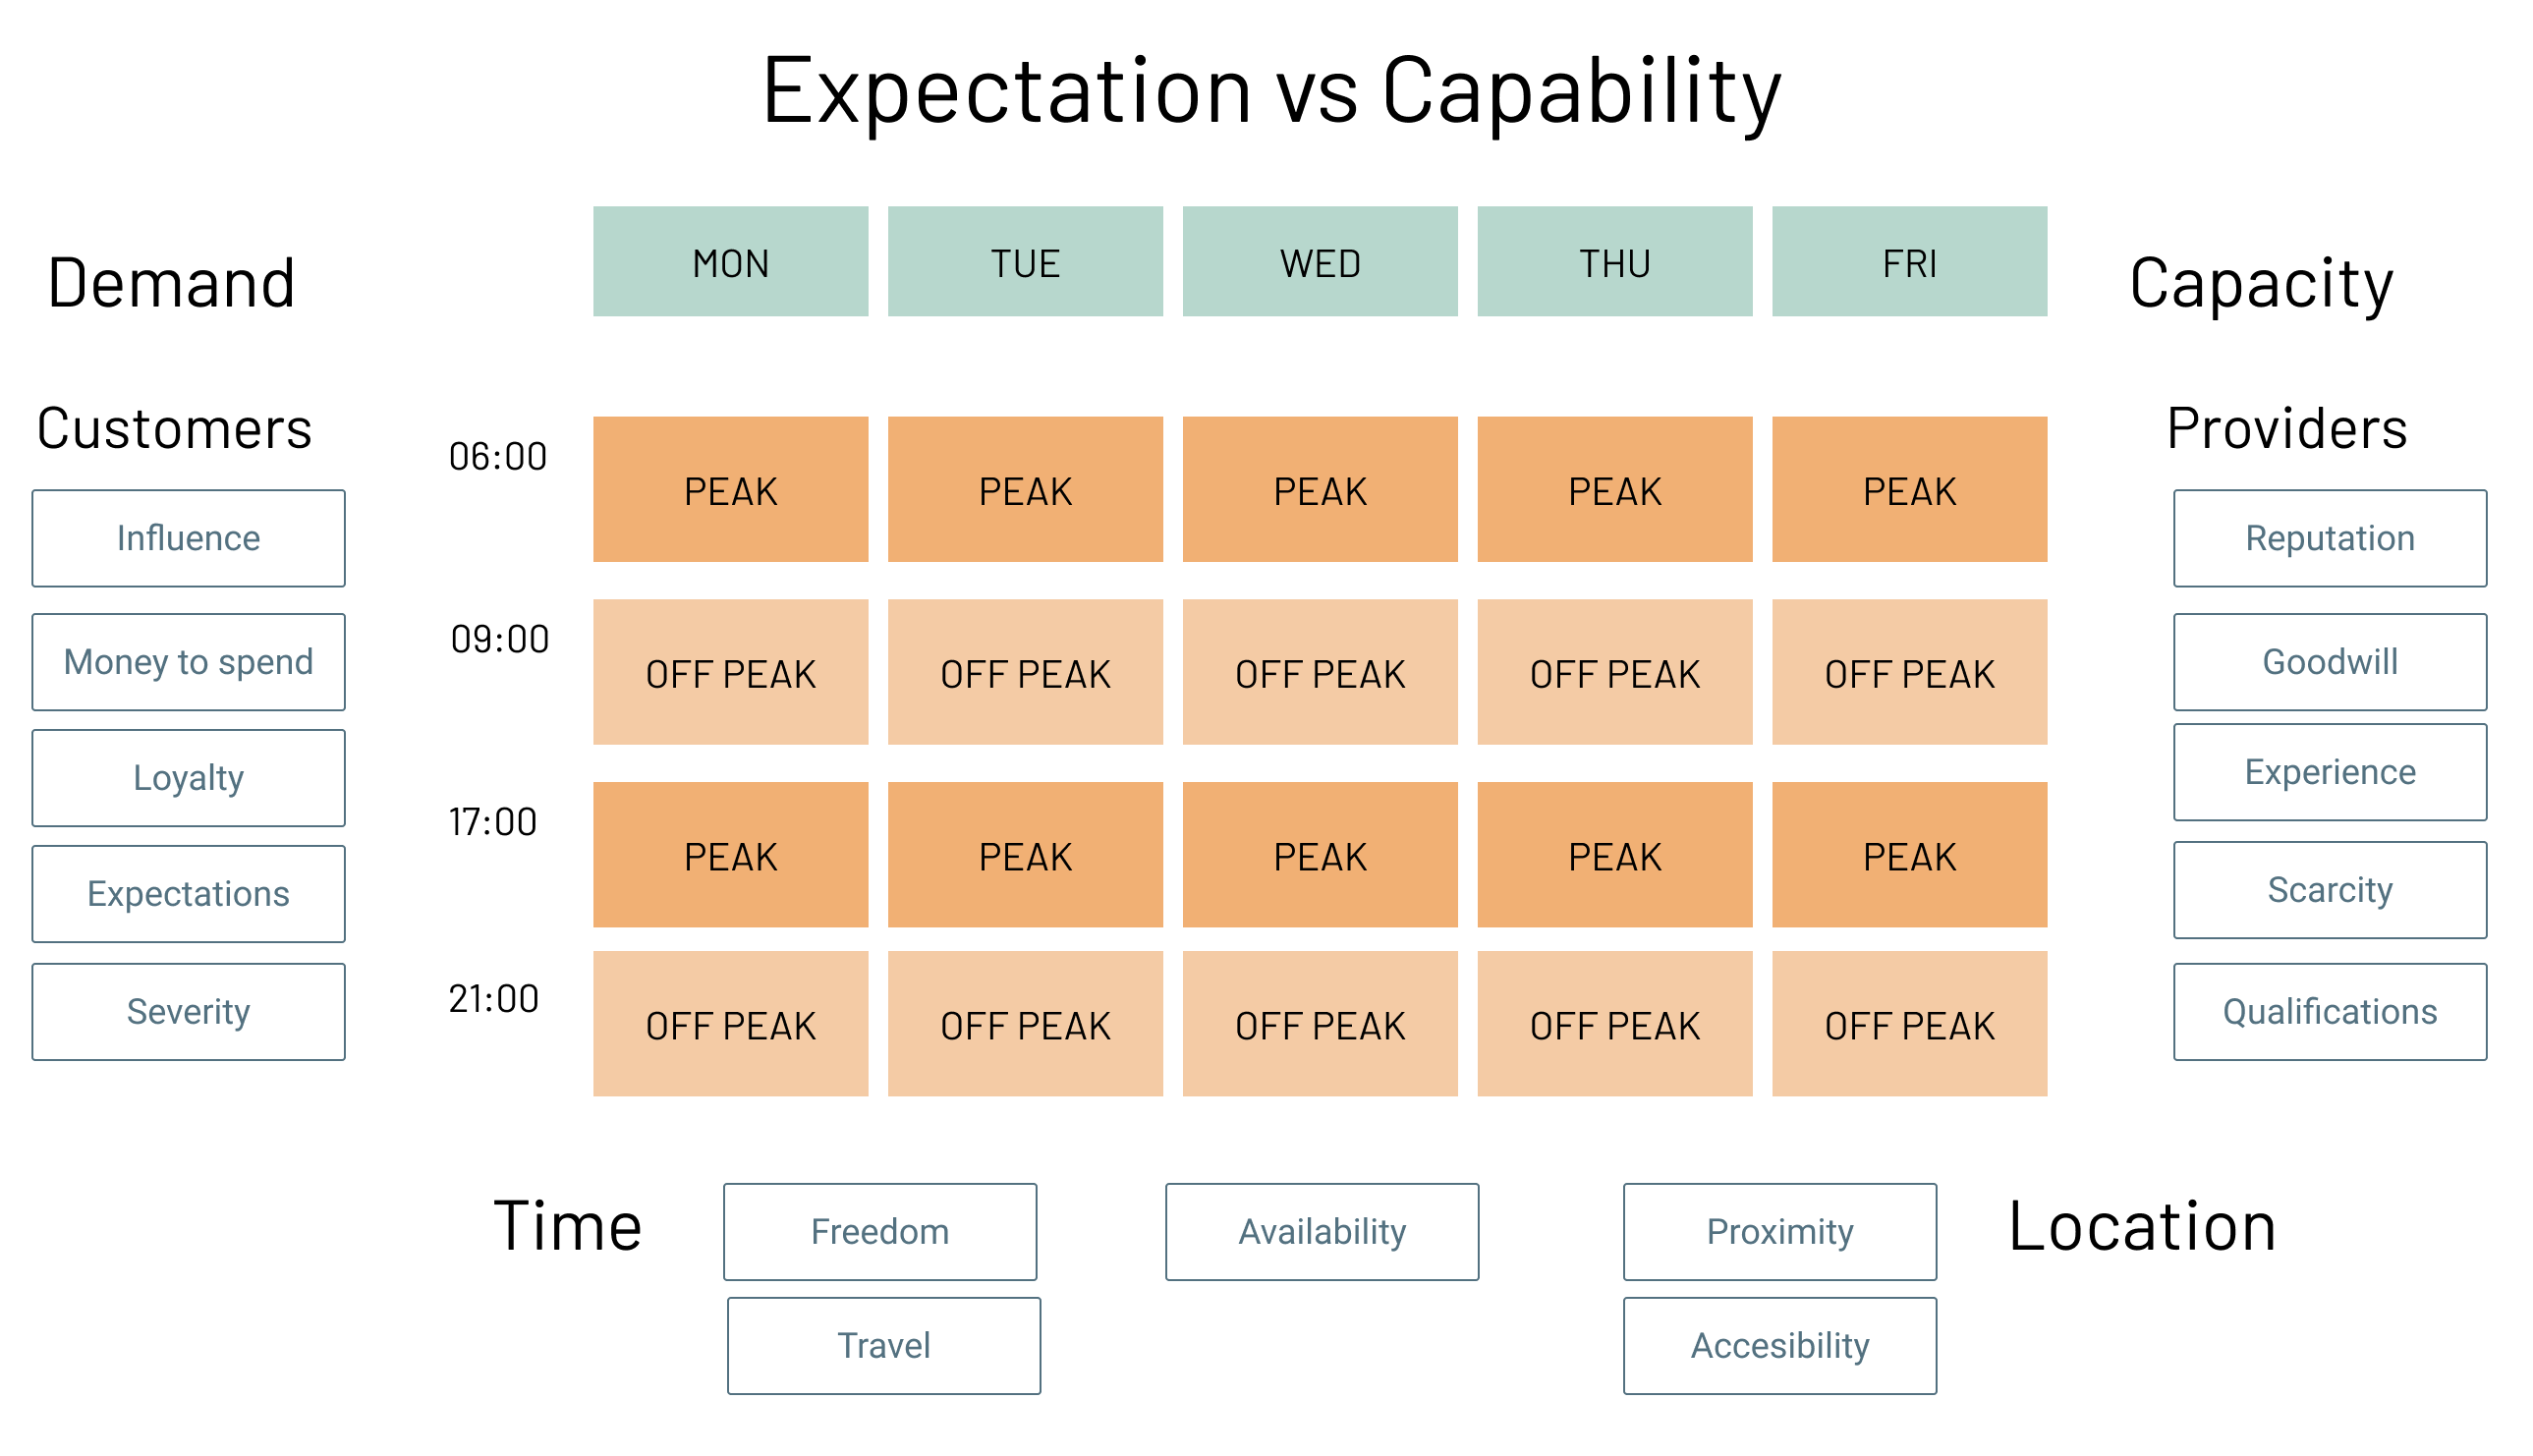
Dynamic pricing as human-to-human (H2H) proof of value exchange — buyer and expert meet in the middle on a price that reflects the value delivered, not the cost base. Both sides see the same value at stake, so the price the exchange settles on is fair to each.
Establish value to the customer, not the cost base plus a notional amount. Pricing is positioning made numeric — get the position wrong and no formula saves you.
Algorithm
Principles informing the algorithm include
- Decisions
- Arbitrage
- Intelligent Hyperlinks
- Demand Driven Sales — The job the buyer is hiring you for
Five steps produce a useful pricing hypothesis. They do not prove willingness to pay. Scores make judgment visible; only buyer behaviour calibrates it.
Step 1: Anchor
Map 3-7 competitors. Extract floor and ceiling.
| Competitor Type | Price Range | What They Sell |
|---|---|---|
| Below you (cheap) | Floor | Volume without strategy |
| Adjacent (similar) | Midpoint | Comparable scope |
| Above you (premium) | Ceiling | Brand premium or full-service |
Output: Anchor midpoint = average of adjacent competitors.
Step 2: Score Demand
Four factors, each 1-5. Multiply to get the demand multiplier.
| Factor | 1 (Weak) | 3 (Moderate) | 5 (Strong) |
|---|---|---|---|
| Pain intensity | Mild annoyance | Regular frustration | Hair-on-fire problem |
| Willingness to pay | Expects free | Pays grudgingly | Throws money at it |
| Alternatives | Many good options | Some options, none great | No real alternative |
| Urgency | Someday | This quarter | This week |
Demand multiplier = (Sum of 4 scores) / 12
Range: 0.33 (all 1s) to 1.67 (all 5s). Midpoint = 1.0.
Step 3: Score Supply
Three factors, each 1-5. Your right to charge.
| Factor | 1 (Weak) | 3 (Moderate) | 5 (Strong) |
|---|---|---|---|
| Expertise depth | Learning on the job | Competent practitioner | Recognized authority |
| Capacity scarcity | Wide open calendar | Selective | Waitlist |
| Track record | Zero proof | Some results | Documented case studies |
Supply multiplier = (Sum of 3 scores) / 9
Range: 0.33 to 1.67.
Step 4: Calculate
Target price = Anchor midpoint x Demand multiplier x Supply multiplier
Step 5: Validate
Run four checks before committing:
| Check | Threshold | If Fails |
|---|---|---|
| Gross margin | ≥60% | Raise price or cut delivery scope |
| Kill threshold | Delivery hours <2x estimate | Reprice or reduce scope |
| LTV:CAC | ≥3:1 | Fix acquisition channel first |
| Prospect reaction | "That's reasonable" or "tell me more" | Reframe value, don't discount |
Price Architecture
Before choosing a number, define what is being bought. Start with the buyer's job and observable result, then use features, people, software, and AI as supporting instruments.
Package the result
A practical progression is:
- Paid proof — reduce the largest uncertainty with a bounded result.
- Outcome — deliver one accepted business result with a correction rule.
- Operating loop — repeat, measure, and improve the result over time.
Each package names its outcome, boundary, buyer inputs, evidence, exclusions, and next decision. Avoid tiers that merely withhold quality or governance.
Build an envelope, not a magic number
| Bound | Question |
|---|---|
| Floor | What price covers expected delivery, downside effort, risk, and required margin? |
| Market anchors | What do credible alternatives cost, and where does their scope differ? |
| Value ceiling | What conservative value is created or loss avoided after probability, time, attribution, and buyer risk? |
| Target/test band | What range between floor and ceiling leaves compelling buyer ROI and can be tested honestly? |
The anchor × demand × supply calculation can suggest a point inside this envelope. It must not hide missing evidence behind precise arithmetic.
Choose a value metric
Charge on a unit that grows when customer value grows and can be audited: an accepted outcome, workflow, qualified opportunity, contract, location, or measured result. Seats, tokens, documents, and agent count are useful only when they genuinely track value or cost.
Use a fixed fee for a bounded result, a retainer for a continuing operating loop, usage pricing when value scales with a measurable unit, and a success fee only when attribution and provider control are strong. A hybrid can fund delivery with a base fee and share measurable upside through a capped variable component.
Evidence and Calibration
Willingness to pay is behaviour, not praise. Prefer evidence in this order:
- paid delivery, renewal, and expansion;
- accepted, rejected, or countered quotes with reasons;
- deposits, paid pilots, or another costly commitment;
- interviews about past behaviour and current alternatives;
- surveys, stated preference, and internal opinion.
Test one major variable at a time: segment, package, value metric, price, or risk reversal. Record the offer, buyer situation, response, delivery effort, result, margin, and what changes for the next quote. A small sample updates confidence; it does not prove a universal market price.
Discounts exchange value rather than leak it: narrower scope, earlier payment, volume, longer commitment, or permission to reuse anonymised evidence. If nothing changes on the buyer's side, lowering the number teaches the market to wait.
Worked Example
Trail Builder tier from Berley Trails — a $2,500/month positioning retainer.
Step 1: Anchor
| Competitor | Monthly Price | What They Sell |
|---|---|---|
| Freelance content writers | $500-$2,000 | Blog posts without strategy |
| Boutique marketing agencies | $3,000-$15,000 | Full-service campaigns |
| Business coaches | $800-$2,000 | Advice without execution |
| HubSpot platform | $800-$3,200 | Software without strategy |
| LinkedIn lead gen | $1,000-$3,000 | Outbound automation |
Adjacent competitors (coaches + freelancers + LinkedIn): $500-$3,000.
Anchor midpoint: $1,750/month.
Step 2: Demand
| Factor | Score | Evidence |
|---|---|---|
| Pain intensity | 4 | 15-25 hrs/week on biz dev that resets monthly |
| Willingness to pay | 3 | Already spending $2,000-5,000/month on marketing (UNVALIDATED for positioning specifically) |
| Alternatives | 3 | Agencies exist but don't do positioning-first |
| Urgency | 3 | AI window 2-3 years — not urgent but timely |
Demand multiplier = 13/12 = 1.08
Step 3: Supply
| Factor | Score | Evidence |
|---|---|---|
| Expertise depth | 3 | Systems thinking background, framework documented |
| Capacity scarcity | 2 | Wide open — pre-launch |
| Track record | 1 | Zero clients, zero case studies |
Supply multiplier = 6/9 = 0.67
Step 4: Calculate
$1,750 x 1.08 x 0.67 = $1,266/month
Step 5: Validate
| Check | Result | Pass? |
|---|---|---|
| Gross margin | 60% at $2,500 (15 hrs x $67/hr delivery) | Yes at actual price |
| Kill threshold | Model breaks at 2x hours (30 hrs = 20% margin) | Flagged |
| LTV:CAC | 30:1 if referral-sourced | Yes |
| Prospect reaction | UNVALIDATED | Unknown |
The Gap
Algorithm output: $1,266/month. Actual price: $2,500/month.
The $1,234 gap is the positioning premium — the bet that fish psychology, ecosystem thinking, and framework IP justify nearly 2x the calculated price. This gap closes as supply scores improve (case studies, waitlist, authority). If it doesn't close and prospects reject $2,500, the algorithm says $1,266 is the honest price.
Context
- Business Principles — Unit Economics and Value Capture constrain every price
- Business Strategy — Set position before setting price
- Sales Operations — Where price meets the prospect
- Persuasion — Price anchoring and framing
Links
Questions
If price is what you pay and value is what you get, how do you measure the gap between them?
- What does your essential algorithm route — and does the price reflect the routing intelligence or just the output?
- When the matrix shows a high disruption score but low density, does that justify premium pricing or prove the market doesn't exist yet?