Performance
What does good look like — and how fast can you tell?
Performance is second in the Tight Five — after Principles, before Platform. The sequence matters. Without principles you don't know what to measure. Without a picture of good, every feedback loop is aimless — generating output nobody can evaluate.
Close the Loop
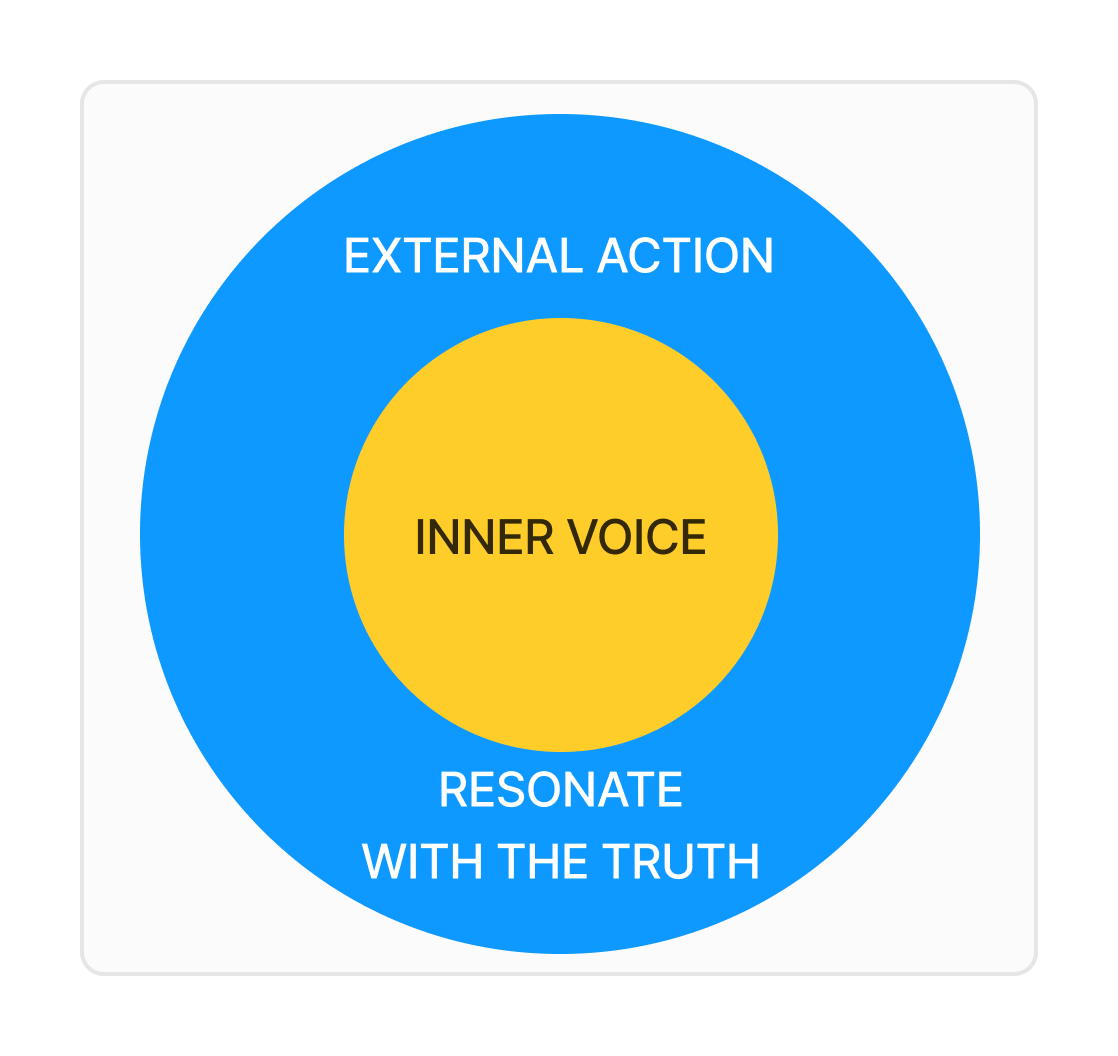
Two loops, one system. The inner loop forms intention — what you believe good looks like. The outer loop tests it against reality. Performance is where they meet.
| Loop | Question | Without Performance |
|---|---|---|
| Inner (intention) | What should this produce? | Building blind |
| Outer (validation) | Did it match the spec? | Feedback without signal |
| Closed (compounding) | What's better this time? | Activity without progress |
The VVFL only compounds when the gauge reads true. Validated — against reality, not assumption. Virtuous — serving beyond self. Feedback — output changes input. Loop — each cycle starts higher.
Commissioning is the discipline: the builder never validates their own work. Syntactically correct is not functionally correct.
The Gauge
The scoreboard is an output. You can't move it directly. You win micro-moments — collisions where standards get followed, thresholds get checked, decisions get made right.
| Level | What It Is | Example |
|---|---|---|
| Micro-moment | The collision you can win | Developer checks contrast before committing |
| Leading indicator | Signal it's compounding | Token resolution rate trending to 100% |
| Scoreboard | The number that moves | Lighthouse score hits 90+ |
| Perspective | What you chose to track | Reveals what you actually value |
What you track reveals your perspective. The ability to perceive which micro-moments matter — that's the competitive advantage.
Benchmark Context
If you don't know widely accepted thresholds for "good," you have no valid context to judge performance. Show me the incentive and I'll show you the outcome.
| Minimum | Why |
|---|---|
| Industry baseline | Where does everyone start? |
| Internal baseline | Where do you start? |
| Target threshold | What does good look like? |
| Measurement method | How do you read the gauge? |
| Review cadence | How fast does the loop close? |
Dig Deeper
📄️ Commissioning
Does the output match the spec — or does it just look like it does?
📄️ Content
Is the content pipeline producing work that lands?
📄️ Crypto
Understanding value creation is crucial for assessing the potential and sustainability of projects.
📄️ Economics
KPIs for Economics and Business Cycle
🗃️ Financials
7 items
🗃️ Human Resources
2 items
📄️ Product Design
How do you know your design is getting better?
📄️ Retail Industry
Measure performance of retail stores.
🗃️ SaaS Valuation
1 item
🗃️ Software
3 items
Context
- Commissioning — Verify the output matches the spec, not just the code
- VVFL — The feedback loop that compounds when the gauge reads true
- Tight Five Loops — Every operational loop on the site, collected
- Control System — PID mechanics: how controllers decide how hard to correct
- Consciousness — Inner space is where better intentions form before outer expression
- Incentive Engineering — Show me the incentive, I'll show you the outcome
- Standards — Thresholds that define what "good" looks like
- Predictions — Betting on which standards win