The Picture
What does success look like for a thinking system that teaches thinking?
A loop without a gauge is motion. This page is the gauge — the outcome map filled in, the picture we measure against.
Three Signals
| Level | Signal | Proxy | Proves |
|---|---|---|---|
| Self | Decisions improve | Choices that reference the model | The system works for its builder |
| Transfer | Better questions out than in | Link depth from entry point | The architecture creates value |
| Compound | Connections create emergent value | Cross-referral from /meta/ into /docs/ | Links are edges, not decoration |
Level 1 before Level 2. Level 2 before Level 3.
Outcome Map
| Dreamineering | |
|---|---|
| Desired Outcome | Each page added makes every other page more valuable |
| Contributing Factors | Six cross-linked nav sections. Meta articles that sell the dream. 400+ docs pages with engineering depth. Templates that transfer the method. |
| Obstacles | No measurement system. Dense entry for newcomers. Bridge between dream (/meta/) and engineering (/docs/) is implicit. |
| Investigations | Which entry pulls deepest? Do meta readers follow links into docs? What is the shortest path from stranger to practitioner? |
| Success Measures | See below |
| Next Actions | Analytics. One hypothesis. Evidence loop. |
Success Measures
Binary. Did we or didn't we.
- Someone traverses Play → Science → Standards → Systems → Scoreboard → Agency
- Someone fills a template and shares the output
- A meta article generates conversation that references
/docs/ - Three decisions improved by externalizing the mental model
The Setpoint
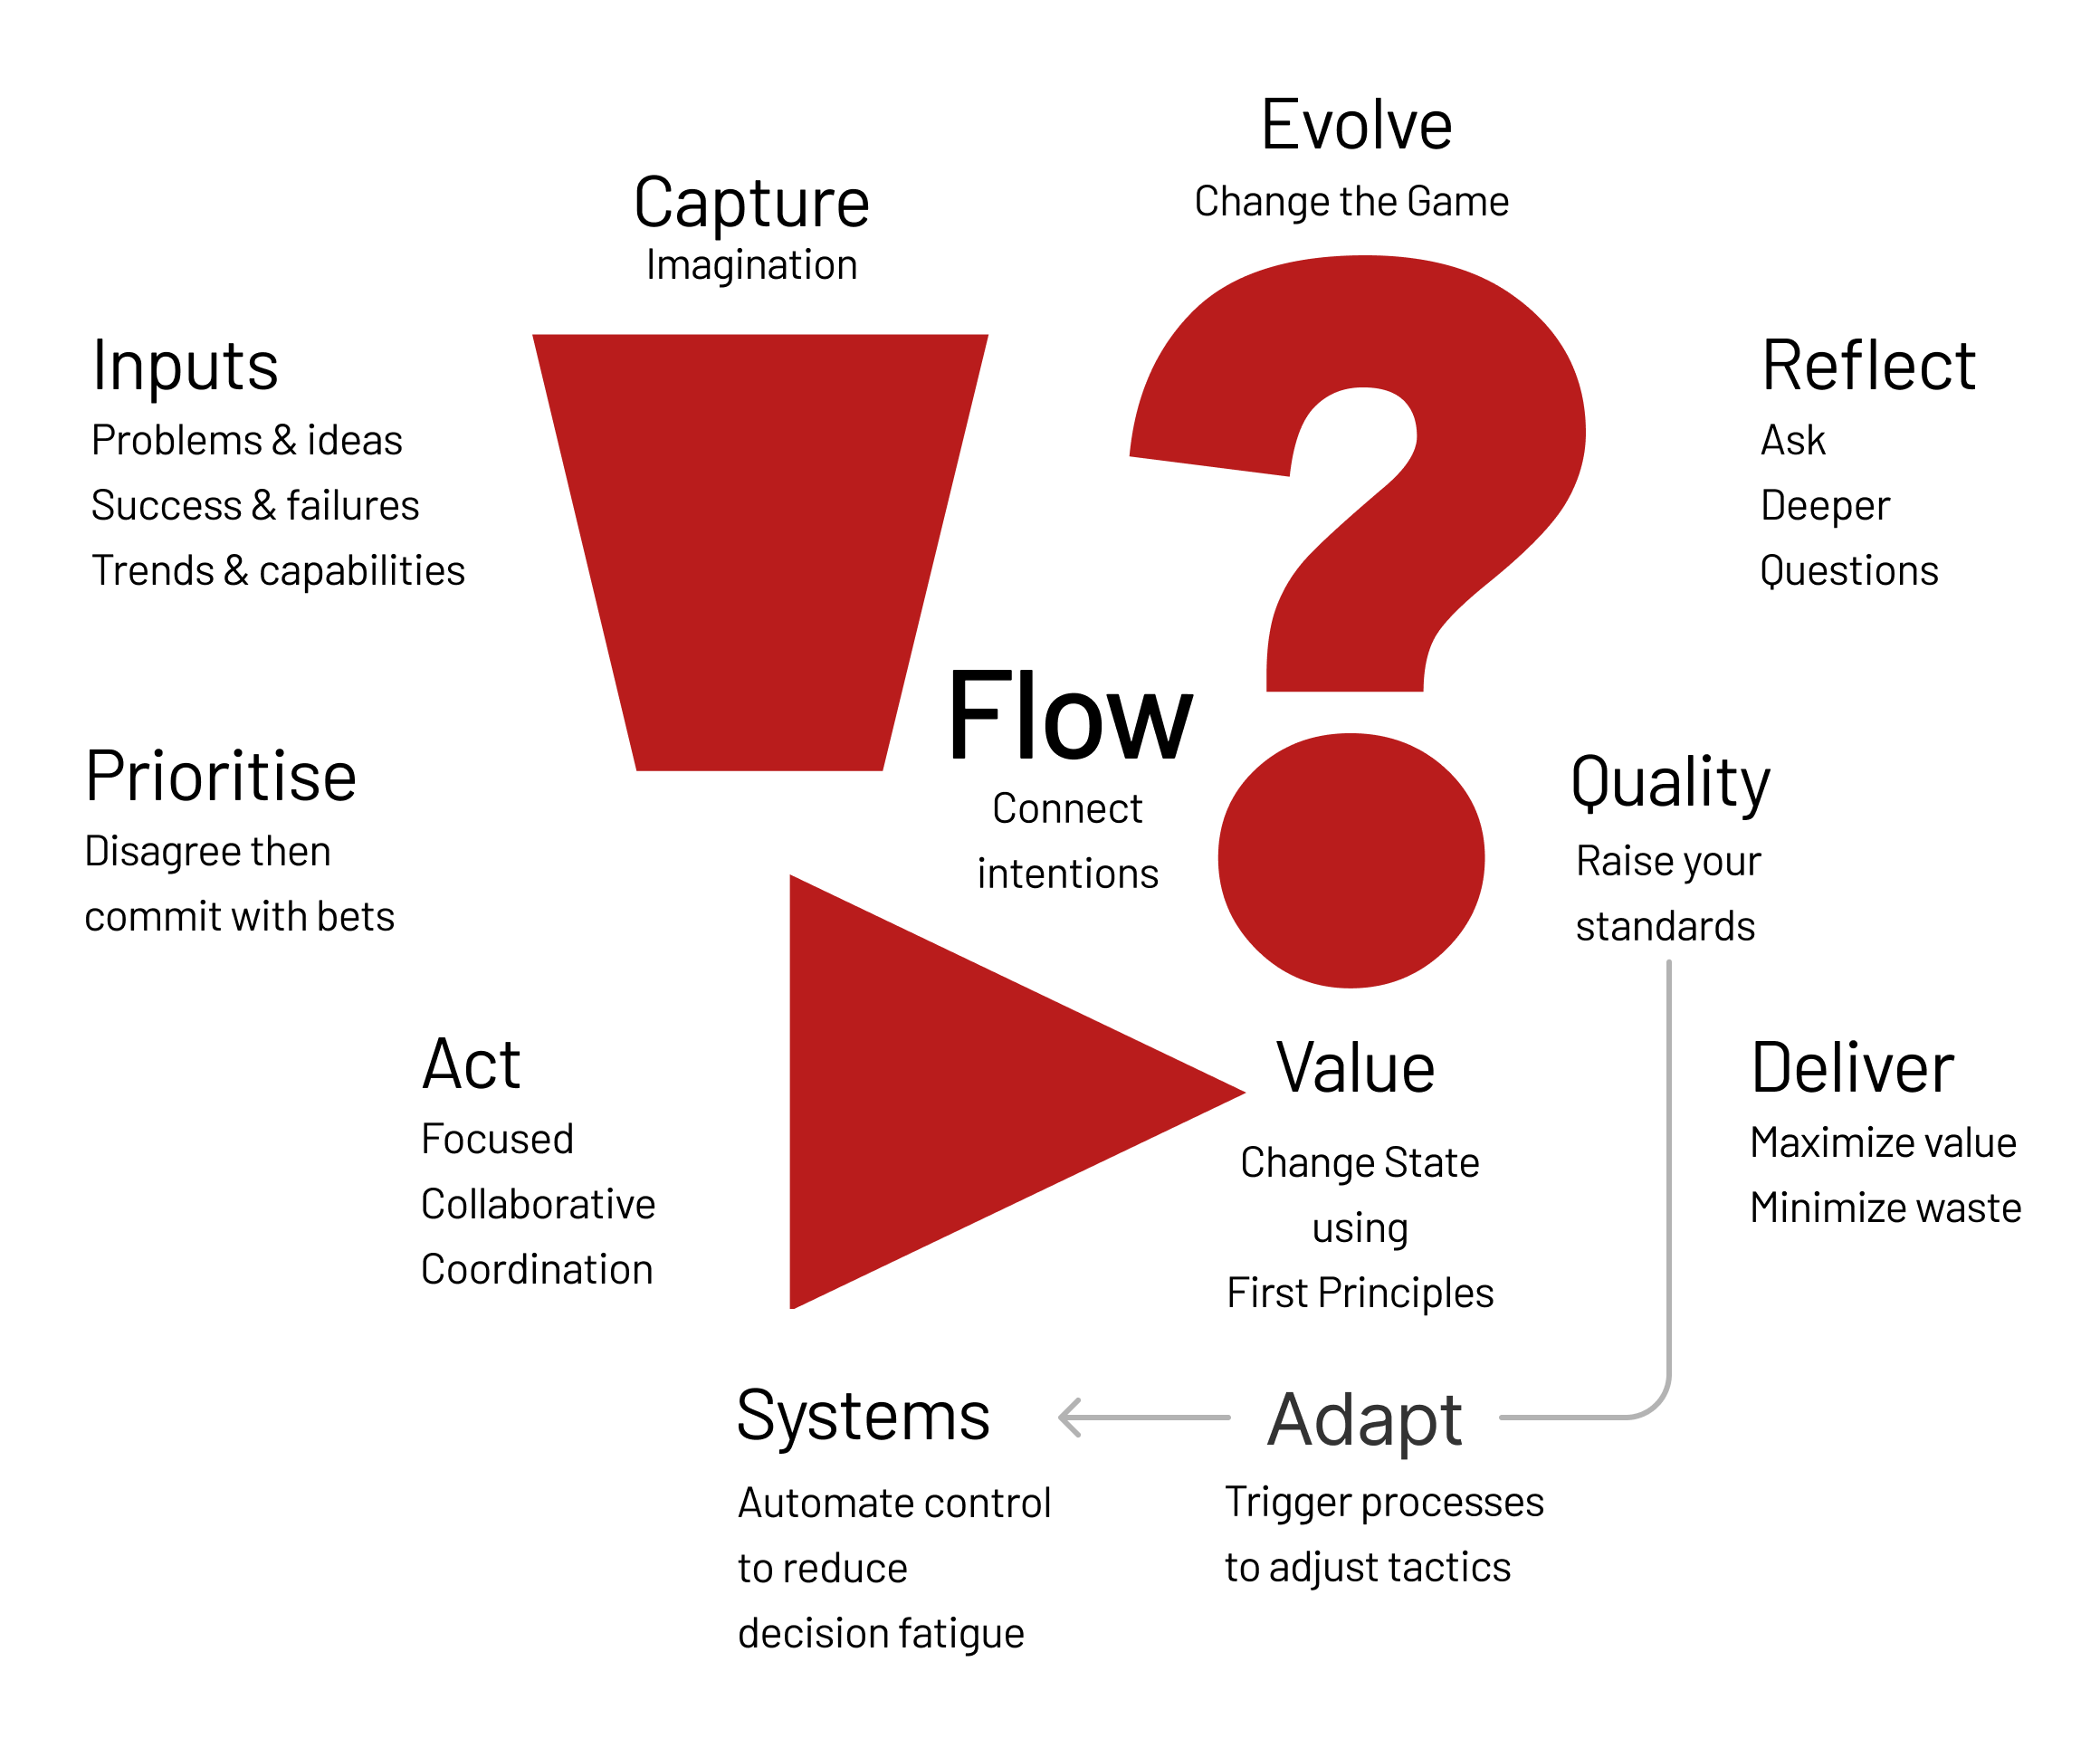
The VVFL runs on every page. Without a setpoint, the gauge reads nothing.
Setpoint: each cycle produces a better question than the last.
Not more content. Not more pages. Sharper questions. Denser connections. Architecture creating value no single page could hold.
If aligned — apply more force. If not — step away and rethink.
Evidence Loop
| Cycle | Hypothesis | Outcome | Better Question |
|---|---|---|---|
| 1 | Cross-linking nav sections creates traversal |
Fill this table. The empty cells are the gauge reading.
Context
- Outcome Map — The blank version of what this page fills in
- The VVFL — The loop this picture measures
- Scoreboard — Where system outputs get measured
- Science — Hypothesis, experiment, compare, iterate
- Evolution — What compounds when the loop runs long enough